In a previous post, I shared data we are collecting at OrthoFi regarding same day starts. In a series of upcoming blog posts, I hope to share more of the data we have collected from over 76,000 new patient exams, 50,000 starts and over $226,000,000 in orthodontic production. Today we discuss treatment conversion and treatment fee. Historically, the amount of competition in the orthodontic space for orthodontic patients was limited to orthodontists and a handful of adventurous general dentists. In today’s orthodontic market we have a have an ever-increasing amount of competitors in our space including other orthodontists, general dentists, corporate dental, mail-order orthodontics, and do-it-yourself orthodontics (gasp!).
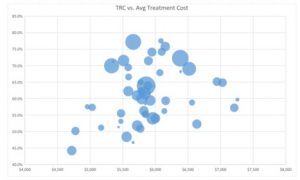
When faced with how to respond to the rapidly increasing competition, I believe most orthodontists’ gut reaction is that the only way to compete with other options is to compete on fee. In a future post on messaging, the data shows the top two concerns patients have are quality and comfort. High-tech treatment and low monthly payments were tied for third, showing people wanted the best treatment so long as it is affordable within their monthly budget. But did their buying data back up their pre-treatment messaging data? The graph below shows Treatment Recommended Conversion (TRC) vs Treatment Fee. TRC is measured by how many starts you get from those patients to whom you recommend treatment and present fees (#starts/#recommends). Although it may yield a lower number than what you’re used to looking at, it’s a much more accurate measure than the traditional ‘case acceptance’ metric (#starts/#NPE), as case acceptance can give very misleading results if the number of new patient exams is not constant and/or you have variability in your recall inflows/outflows. The data is presented on the following graph:
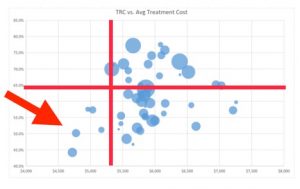
This bubble chart is intended to show the correlation of fees and conversion rate. On the Y-axis, you have TRC (see above), the percentage of Tx recommends that say ‘YES’. The X-axis shows average treatment fee. The bubbles represent practices from around the country with the size of the bubble indicating size of the practice. Pricing theory would normally lead you to think that the graph should have a general trend of upper left to lower right (higher price yields lower conversion). However, an interesting finding appears with addition of these red lines. The horizontal line is the benchmark conversion percentage of 65%. A TRC over 65% would be considered good and a TRC above 75% would be excellent. There are many ways to artificially inflate TRC and case acceptance, which mislead doctors to think they convert better than they actually do, but that’s a topic for another post. The vertical red line is set at $5,300 treatment fee as an aid to help uncover the underlying trend.
The bottom left hand corner of the graph shows the lowest conversion rate combined with the lowest TRC. As you can see, the group with the lowest fee is also the area representing the lowest conversion – very interesting. In fact, the office with the lowest average fee out of all OrthoFi practices also has the lowest TRC. So in most cases, building your strategy on low fees to win the day is not founded on solid ground. We do not, however, have data for offices charging less than $4500 for full treatment. There really isn’t any correlation between price and conversion on fees ranging from $5,300 all the way up to $6,500. As most of us know, excellent conversion rate is the product of much more than any one single thing. But I see a lot of doctors reacting to increased competition by lowering their fee or doing a lot of discount promotions. What you probably should do if your conversion percentage is slipping is look at all the factors other than treatment fee that may be contributing to lower conversion – especially if you’re a lower priced provider whose fee is under $5,000 a year.
Any good wine tasting sommelier knows that people automatically associate a wine’s price with its quality. There’s a famous marketing study that backs that up. You don’t need to practice in Detroit like I do to see that the automotive industry has put a lot of people with Buick budgets into Cadillacs, right? That’s because car companies, even the high-end import brands, have seen huge growth in their private and corporate leasing programs – high quality at more affordable monthly rates. The future may very well have in store a reduction in treatment fees across the board, however our current data confirms: people prefer higher quality orthodontics to lower cost orthodontics – as long as it’s affordable.
NEXT UP: What are the most popular down payment and monthly options?
WANT TO LEARN MORE? Attend my upcoming webinar on July 21st at 8pm EST.


Interesting post! Though I wonder what the effect of local competitive prices might be. For example, if you practice in an area where other orthodox charge $5K and you charge $6K, does that price you out of the market or create a perception that you are worth more?
Sorry for the double post, but I also wonder at the direction of causality between prices and starts in the low-start practices. Are their starts low because their fees are low, or did they lower their fees because their starts were low? Regardless, I find this data fascinating and look forward to more info on the subject.
Hi Jeremy.
Thanks for the questions! The purpose of this post was to show that, for most offices, the total price is irrelevant. There are many other factors involved in the patient’s selection of your practice other than the total price and conversion has very high variability across offices with similar price point. I would argue (and have data to back it up in upcoming blog posts) that affordability is much more important than total cost. And not just for the so-called ‘C’ patients.
To speak to your first question, if you are going to charge $1000 more than your competition, you better create some value for the patient (perceived or actual–preferably both). So, if everything is the same, people will likely choose the lower price. However, people will pay more in total price so long as the affordability is right and there is some value for them to justify the higher price.
To speak to your second question, I don’t have any data-driven response to give you. But, I have heard many doctors contend that they have to lower their price to compete and I believe–and the data shows–that price is not the most important factor in a patient choosing your office. Investing in the new patient process and in your customer service would likely pay big rewards and increase TRC without lowering price.
Hope that helps and thanks for the comment!
jamie
It depends on your image, position, and reputation.
HI Jamie, thanks for your reply. What I was alluding to in my previous questions was the idea that we can’t make assumptions about whether cost is “irrelevant” in conversion with cross sectional data.
I’d love to see longitudinal data of practices that started at one conversion rate, changed the price, and monitored change in conversion. That would better support the notion that cost is or is not irrelevant.
Also, we need to account for the effect of other variables such as SES of the neighbourhood of the practice. For all we know, the low-cost, low-conversion practices might be in low SES areas, which would explain both cost and conversion, and negate the idea that the low conversion was in any way due to cost.
Regardless, I look forward to your next posts and hearing more about the variables that you found to be more significant.
Agreed Jeremy. Smart response. There are many factors at play in TRC and this post certainly does not speak to them all (and was not intended to). Nor does this chart look at more than TRC compared with total price. The point here was to illustrate that there is something more at play here than price due to the high variability of TRC across similar price points. But, I have some more posts planned that look at more factors and will help shed light into more important parts of patient conversion.
Great article! As a Treatment Coordinator for many years and now an Orthodontic Consultant, monthly affordability, the patient experience and value is key in conversion.
Excellent thought provoking data! Thanks for putting it out there for us to read and infer!
Thank you for presenting the material. Very nicely laid out. Would you be able to tell us if the practices with lower fees had a similar payment option to those with higher fees? Also, on average do the higher fee offices obtain a higher average down payment or are they all about the same?
Hi Milan
Thanks for the comment. All the practices compared were OrthoFi practices. So, the payment options are populated to the payment slider (where they are presented to the patient) by a proprietary credit algorithm which applies evenly to all practices.
Your second question is a great one which will make a great post. Hang on for the answer and I will show all the data. For a sneak peak, there is variability among offices charging the same fee and there is also variability in the same office between different TCs. Lots of moving parts and pieces in the payment presentation process and total price is only one of the variables.
Thanks again for the thoughtful questions.