In previous posts, I shared some of the data we are collecting at OrthoFi. In a series of blog posts, I hope to share more of the data we have collected from over 60,000 starts and over $300,000,000 in orthodontic production. Today we discuss cash flow management. In my last post, I discussed the concept of leverage in your practice. If you haven’t read that post yet, stop here and read it now. The following conversation will be much more meaningful considering the context created by that post. Before discussing the philosophies of cash flow management, it is important to emphasize that orthodontists, in general, don’t manage their cash flow well. Far too many of us practice what I like to call ‘lemonade stand’ cash management. We sell our lemonade (pronounced ‘braces’), collect money, pay bills, and smilingly shake the cash box on our way to spend what is left over. ‘Real’ businesses understand seasonal swings, and strategically budget the amount of operating profit they spend over time. They then periodically (semi-annually rather than monthly or weekly) bonus the extra earnings into a reserve cash fund. Only when the reserve cash fund becomes large enough to cover several months’ expenses do they sweep the leftover cash into the profit bucket. This concept is especially key in a growing business, as expenses can outpace intake during periods of rapid growth and cash reserves are necessary to make rapid growth manageable.
Before you become more flexible, and before you focus on generating intelligent leverage, it is important to assess your current cash flow situation. Regardless of how smart you are with your cash flow, if you’re shifting from a starting point of requiring a $1,500 or more down payment from every patient to allowing flexible options, your cash flow will temporarily tighten up. But, the reward for that flexibility will pay significant dividends. Growth will translate to much more revenue and profit in the long run, however you need to consider your short-term cash reserves before you implement these suggestions and be sure to build up extra cash for the first few months of growth-related cash depletion. You may not want to go to this length, but many businesses with high margins like ours use short-term lines of credit to infuse cash to fuel growth. Ideally, all clients would pay in full, thereby eliminating the need for the office to finance receivables. The orthodontist would only need to manage their savings (as discussed above) to allow the business to cover expenses in the leaner months. However, a majority of patients and families cannot afford to pay in full, which is why we’ve had to provide financing—which then means we need to manage cash flow. There are two philosophical routes to consider when structuring your financing to allow appropriate cash flow while simultaneously creating leverage: transactional cash flow management and aggregate cash flow management.
Transactional Cash Flow means evaluating every single financial transaction in a vacuum and determining the cash flow requirements for the office based on that transaction. For example, if the patient wants Invisalign, then you would need to collect, at minimum, the lab fee upfront to avoid being cash flow negative on that particular transaction. This is the most common modality for cash flow management in orthodontics. Although it makes cash flow management much simpler, it is clear from the data that transactional management is the single biggest impediment to growth in orthodontics today.
Aggregate Cash Flow is the strategy recommended by OrthoFi, as it allows you to intelligently create leverage in your business while setting a healthy and consistent cash flow. You are able to allow flexibility to those that need it – and who would not start treatment without it – and still offer fair and enticing terms to those who could afford to pay more upfront. It does not cover each individual transaction, but rather the blended impact of all total transactions. So, rather than managing each transaction individually, you monitor Key Performance Indicators (KPIs) that give you the state of your aggregate cash flow situation, and manage your cash accordingly.
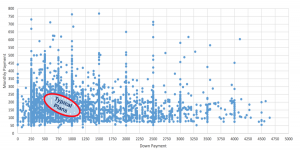
How do you ensure a healthy aggregate balance? Take a look at the chart below. Each of these dots represents a plan chosen by patients over an 18-month period, with the horizontal axis showing down payments selected (excludes all PIFs), and the vertical showing all monthlies selected. As you can see, there is an ocean of dots extending far outside the typical average plans offered around the country. Yes, some are lower down and monthly selections, but a significant number are well higher on both ends, meaning positive cash flow. So how is this scatter created? Open choice….
Let’s start with the down payment: most offices offer a discount for PIF to entice at least 20% to pay this way, then a 15-20% down with payments for those who can’t. It doesn’t have to be a binary choice of either pay-in-full or lower down and monthlies. Very few practices ever get 75% or 50% down because, for the most part, there’s no incentive for a patient to do that. Why not create tiered down payment incentives, with scaling higher down payments?For example, if you offer 5% PIF discount, adding 3% and 2% incentives for 75% and 50% down respectively is proven to be very effective in stimulating more patients to pick higher down options. So across over 130 OrthoFi practices, 22% of cases pay in full, and the average down payment on the rest is $834, even though the vast majority of patients had the choice to put as little as $0 down. When all these choices are blended together, the average initial payment per case is $1,354—plenty of cash flow to run a growing practice.
As for monthlies, the key is to offer extended options, but financially incentivize patients to pick shorter plans. Most practices don’t charge interest on payment terms, even if they extend a few months past treatment. If you simply extend plans by adding an extended 0% option to your menu, you will most likely hurt your cash flow because there is no reason for someone not to pick a shorter option (no disincentive for extended terms). Instead, by adding a modest amount of interest to extended financing plans, you guide those patients that can afford it to shorter plans. So again, some patients choose up to 36 months if they need to, but the average plan length over 60,000 starts is 21 months, with an average monthly payment just under $200. Probably not far off from what you’re doing now… The combination of these two tactics yields a much wider scatter of plan choices both on the high and low end to create an aggregate cash flow that is sustainable, while allowing flexibility to those that need it.
So how do you know it’s working? Adopting an aggregate cash flow model seems like a leap of faith – a bet of sorts that all the ‘dots’ will come together and collectively balance out. But the truth is that to work in aggregate, you need to have solid metrics to know that it’s happening, to be able to adjust where needed when you’re off the mark. Here are the two critical metrics we look at:
Same Day Cash (SDC): the combination of the money you receive each day from pay-in-full (PIF) patients and down payments (DPs). So, SDC = (PIF + DP)/Total Patient Responsibility Production. Patient Responsibility Production is Total Production minus Insurance Coverage.
As suggested by some consultants, approximately 20% of patients should pay in full. Of the remaining 80% of receivables, 17% should be collected as a down payment (17% of 80% is 14%). So, if you add 20% pay-in-fulls to the 14% coming from down payments, your SDC should equal approximately 34% of your total patient receivables. This does not mean that every single patient that starts treatment will put 17% down. It means that the average of ALL patients should yield a 15-20% down average and a 34% total SDC, which equates to an average initial payment amount of $1,345.
With that, you should have sufficient cash flow to pay your bills, with the remainder coming in annuity payments over the coming months (if your receivables are properly managed – a topic for a future post). Once you are able to monitor this powerful metric, you can now properly manage in aggregate. So when you have a month with an SDC% higher than your target, instead of taking that extra money out of the lemonade stand register, you should reinvest that cash to balance out the months in which starts come in with fewer pay-in-fulls or lower downs. Over time, with the growth that flexibility will produce, the VOLUME of Same-Day-Cash dollars will increase and compound to where it will yield a very nice semesterly or annual bonus for you.
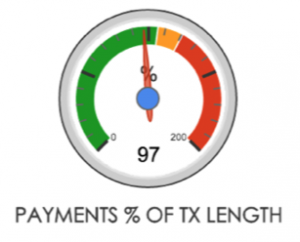
Payment % of Treatment Length (PTL): this KPI monitors how closely your average financing terms are to the average estimated treatment length. So, in our office we use many systems that facilitate shorter treatment times (my office averages 16 months across all full treatment patients), our PTL would reflect how close the average payment term is to that 16 months. Again, this allows us to manage risk appropriately by allowing the people who need extended terms while, at the same time, not increasing aggregate risk and front office burden by creating a large chunk of overall business choosing long-term payment financing
The above gauges are actual numbers from my personal dashboard showing our KPIs are nicely in line. I can allow any individual to choose the terms that are right for them by monitoring only these indicators and not micromanaging every single transaction. That’s is how you intelligently create leverage to scale your business and not become overly cash poor in the process.
UP NEXT: SYSTEMS – How to shore up leaks in your ‘pending’ patients bucket


Thank you for this article Jamie. Bit of delayed comment/question – – I have just been catching up on the blog posts!
Why do you choose to calculate SDC with Total Pt Responsibility Production versus Pt portion and Insurance portion? Thanks-
Seth